Every barrel is booked.
A ledger moves a stock along each relation, one day a step. A flow that leaves the model goes to a boundary account, so the total is conserved to round-off.
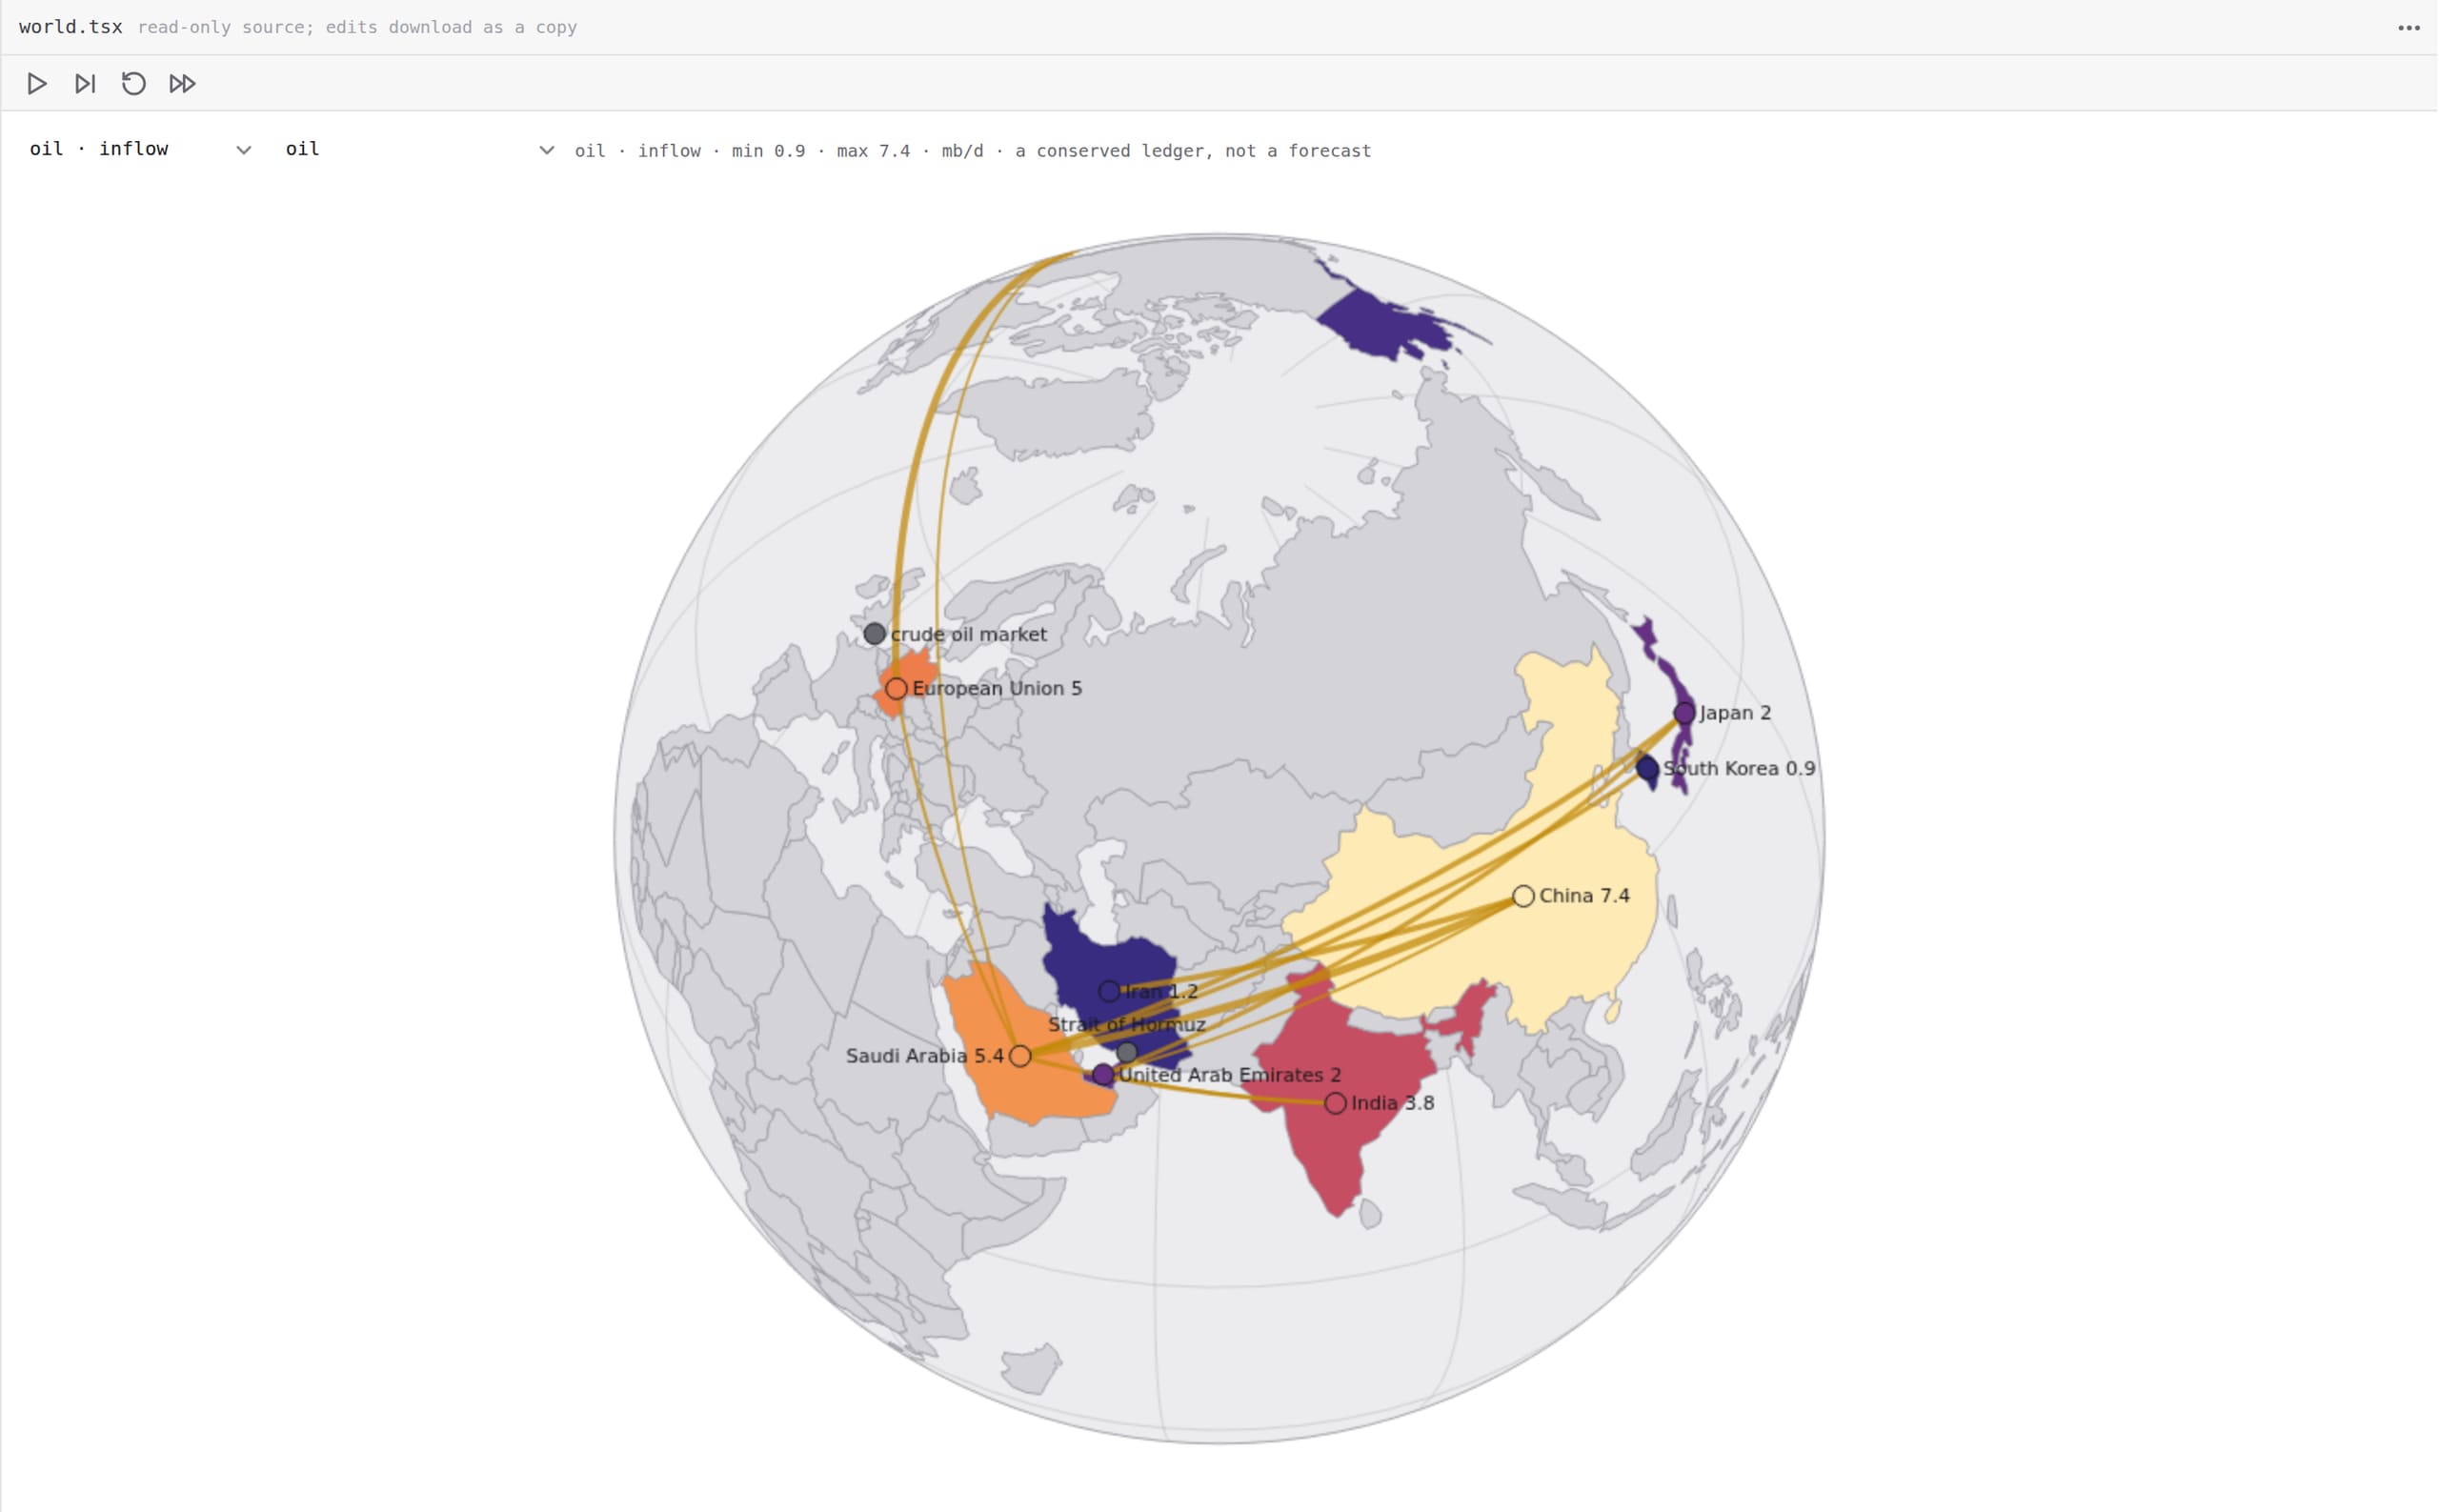
The ledger
dS/dt = inflow − outflow.
A ledger reads the relations of one kind. Each entity's restriction withholds that share of its outbound flow, and the stock is never clamped.
120 days, read every 10.
scripts/sites/case-studies.mjs hormuz stepped the shipped world in the one engine (sim-engine.js) at its own parameters: escalation 1.8, Saudi exposure 0.6. Its oil rates and stocks are declared round numbers, not measurements, and its description says so.
day   0  closure  0.0%  price  $80.0  China 900.0  India 70.0  Japan 480.0  residual 0
day  20  closure 30.5%  price  $87.0  China 897.7  India 69.3  Japan 478.9  residual -4.5e-13
day  40  closure 43.7%  price $114.7  China 877.3  India 62.8  Japan 469.8  residual -2.3e-12
day  70  closure 44.2%  price $117.2  China 844.7  India 52.5  Japan 455.1  residual -2.7e-12
day  90  closure  0.0%  price  $91.5  China 833.4  India 49.0  Japan 450.1  residual -3.2e-12
day 120  closure  0.0%  price  $80.1  China 833.4  India 49.0  Japan 450.1  residual -3.2e-12
The drawdown
India loses 30% of its stock.
India's stock falls from 70.0 to 49.0 million barrels; China's from 900 to 833.4. After the strait opens, inflow and outflow balance again, so the stocks hold where they fell (case-studies/hormuz/stats.json).
Conserved, and checked. The run records oil.total and oil.residual each step. Here the residual never passed 5 × 10⁻¹² mb. Structural, not a forecast. A ledger is an accounting identity. Every surface that shows its numbers says so. One file. The entities, the relations and the three systems are one world.tsx. Change a rate and run it again.
- million barrels in India's reserve
- 70.0 → 49.0
- million barrels in China's
- 900 → 833.4
- mb, the largest residual of the ledger
- 5 × 10⁻¹²
Simulated
In the geo-hormuz simulation at escalation 1.8, China's stock falls from 900 to 833 million barrels and Japan's from 480 to 450 between day 0 and day 90, then holds. A run of the world's declared oil numbers (case-studies/hormuz/stats.json).
Os números
| Day | China | Japan |
|---|---|---|
| 0 | 900 mb | 480 mb |
| 10 | 900 mb | 480 mb |
| 20 | 898 mb | 479 mb |
| 30 | 888 mb | 475 mb |
| 40 | 877 mb | 470 mb |
| 50 | 866 mb | 465 mb |
| 60 | 856 mb | 460 mb |
| 70 | 845 mb | 455 mb |
| 80 | 836 mb | 451 mb |
| 90 | 833 mb | 450 mb |
| 100 | 833 mb | 450 mb |
| 110 | 833 mb | 450 mb |
| 120 | 833 mb | 450 mb |
cloud://global/examples/simulations/geo-hormuz/geo-hormuz.3d.tsxOutput case-studies/hormuz/stats.jsonTool scripts/sites/case-studies.mjs hormuz: sim-engine.jsRan on This computer (dell-gb10-1)When Real stocks
Refugees, as UNHCR counts them.
The geo-displacement world's ledger reads UNHCR's refugees by country of asylum from CommandAGI's Drive (statistics/population/unhcr/refugees-by-asylum.csv, sha256 21f2c9c1…). The engine does not run until that file is read. The 170 hosts start at their 2024 year-end counts. Each host's net change over 2025 is one flow to or from an account outside the count. After 365 one-day steps, every stock is UNHCR's 2025 count. Run 20261105t140731z-1zsh records the year it read (2025, from 2024) and the file's sha256 (case-studies/displacement/stats.json).
Not a corridor. The file counts refugees by country of asylum only, so it does not say where a change came from or went: new displacement, returns, resettlement, naturalisation and revisions all pass through the one account outside the count. One scenario. Türkiye withholds returns_held of its net outflow. At 0.5 it ends 2025 at 2,665,574.5, not 2,390,414. Source: UNHCR Refugee Data Finder.
Simulated
- refugees in all 170 hosts, end of 2024 to end of 2025
- 30,958,200 → 28,461,306
- in Iran, the largest fall; Türkiye 2,940,735 → 2,390,414
- 3,489,257 → 770,514
- in Libya, the largest rise
- 200,335 → 552,523
- people, the largest gap between a stock and UNHCR's count
- 8 × 10⁻⁸
cloud://global/examples/simulations/geo-displacement/geo-displacement.3d.tsxOutput case-studies/displacement/stats.jsonTool scripts/sites/case-studies.mjs displacement: sim-engine.jsRan on This computer (dell-gb10-1)When Close the strait yourself.
Open the world, change its escalation parameter and run it again.