What every sector needs from the others.
A Leontief table says how much each sector must make for the others and for final demand. Cut demand for one, and the engine solves what all of them must make.
The model
x = (I − A)⁻¹ f.
z is the relations between members, f the final demand, x each sector's output. A shock is a cut in final demand, f × (1 − restriction). The engine refuses a table whose spectral radius is 1 or more.
Outputs, billion USD a day.
scripts/sites/case-studies.mjs hormuz stepped the shipped world at escalation 1.8. Each line is the system's solution that day.
day   0  price  $80.0  energy 1060.0  manufacturing 2890.0  services 3820.0
day  30  price $108.0  energy 1026.7  manufacturing 2885.8  services 3816.3
day  70  price $117.2  energy 1015.7  manufacturing 2884.4  services 3815.0
day  90  price  $91.5  energy 1046.3  manufacturing 2888.3  services 3818.5
day 120  price  $80.1  energy 1059.9  manufacturing 2890.0  services 3820.0
The ripple
Energy falls 4.2%. The others feel it less.
At the height of the crisis energy's output is 1,015.7 against 1,060.0, manufacturing's 2,884.4 against 2,890.0 (case-studies/hormuz/stats.json).
A requirements calculation. What the table computes is structural: what each sector must make. It is never a calibrated forecast. Real tables are in the Drive. BEA's input–output tables are in CommandAGI's Drive as consumes and produces relations (48 MB on dev). This world does not read them yet. Solved to 10⁻¹⁰. A Neumann series to a tolerance of 10⁻¹⁰ within 10,000 rounds. Running out of rounds is recorded, never hidden.
- energy's required output at the height
- −4.2%
- manufacturing's
- −0.2%
- days solved, day 0 to day 120
- 121
Simulated
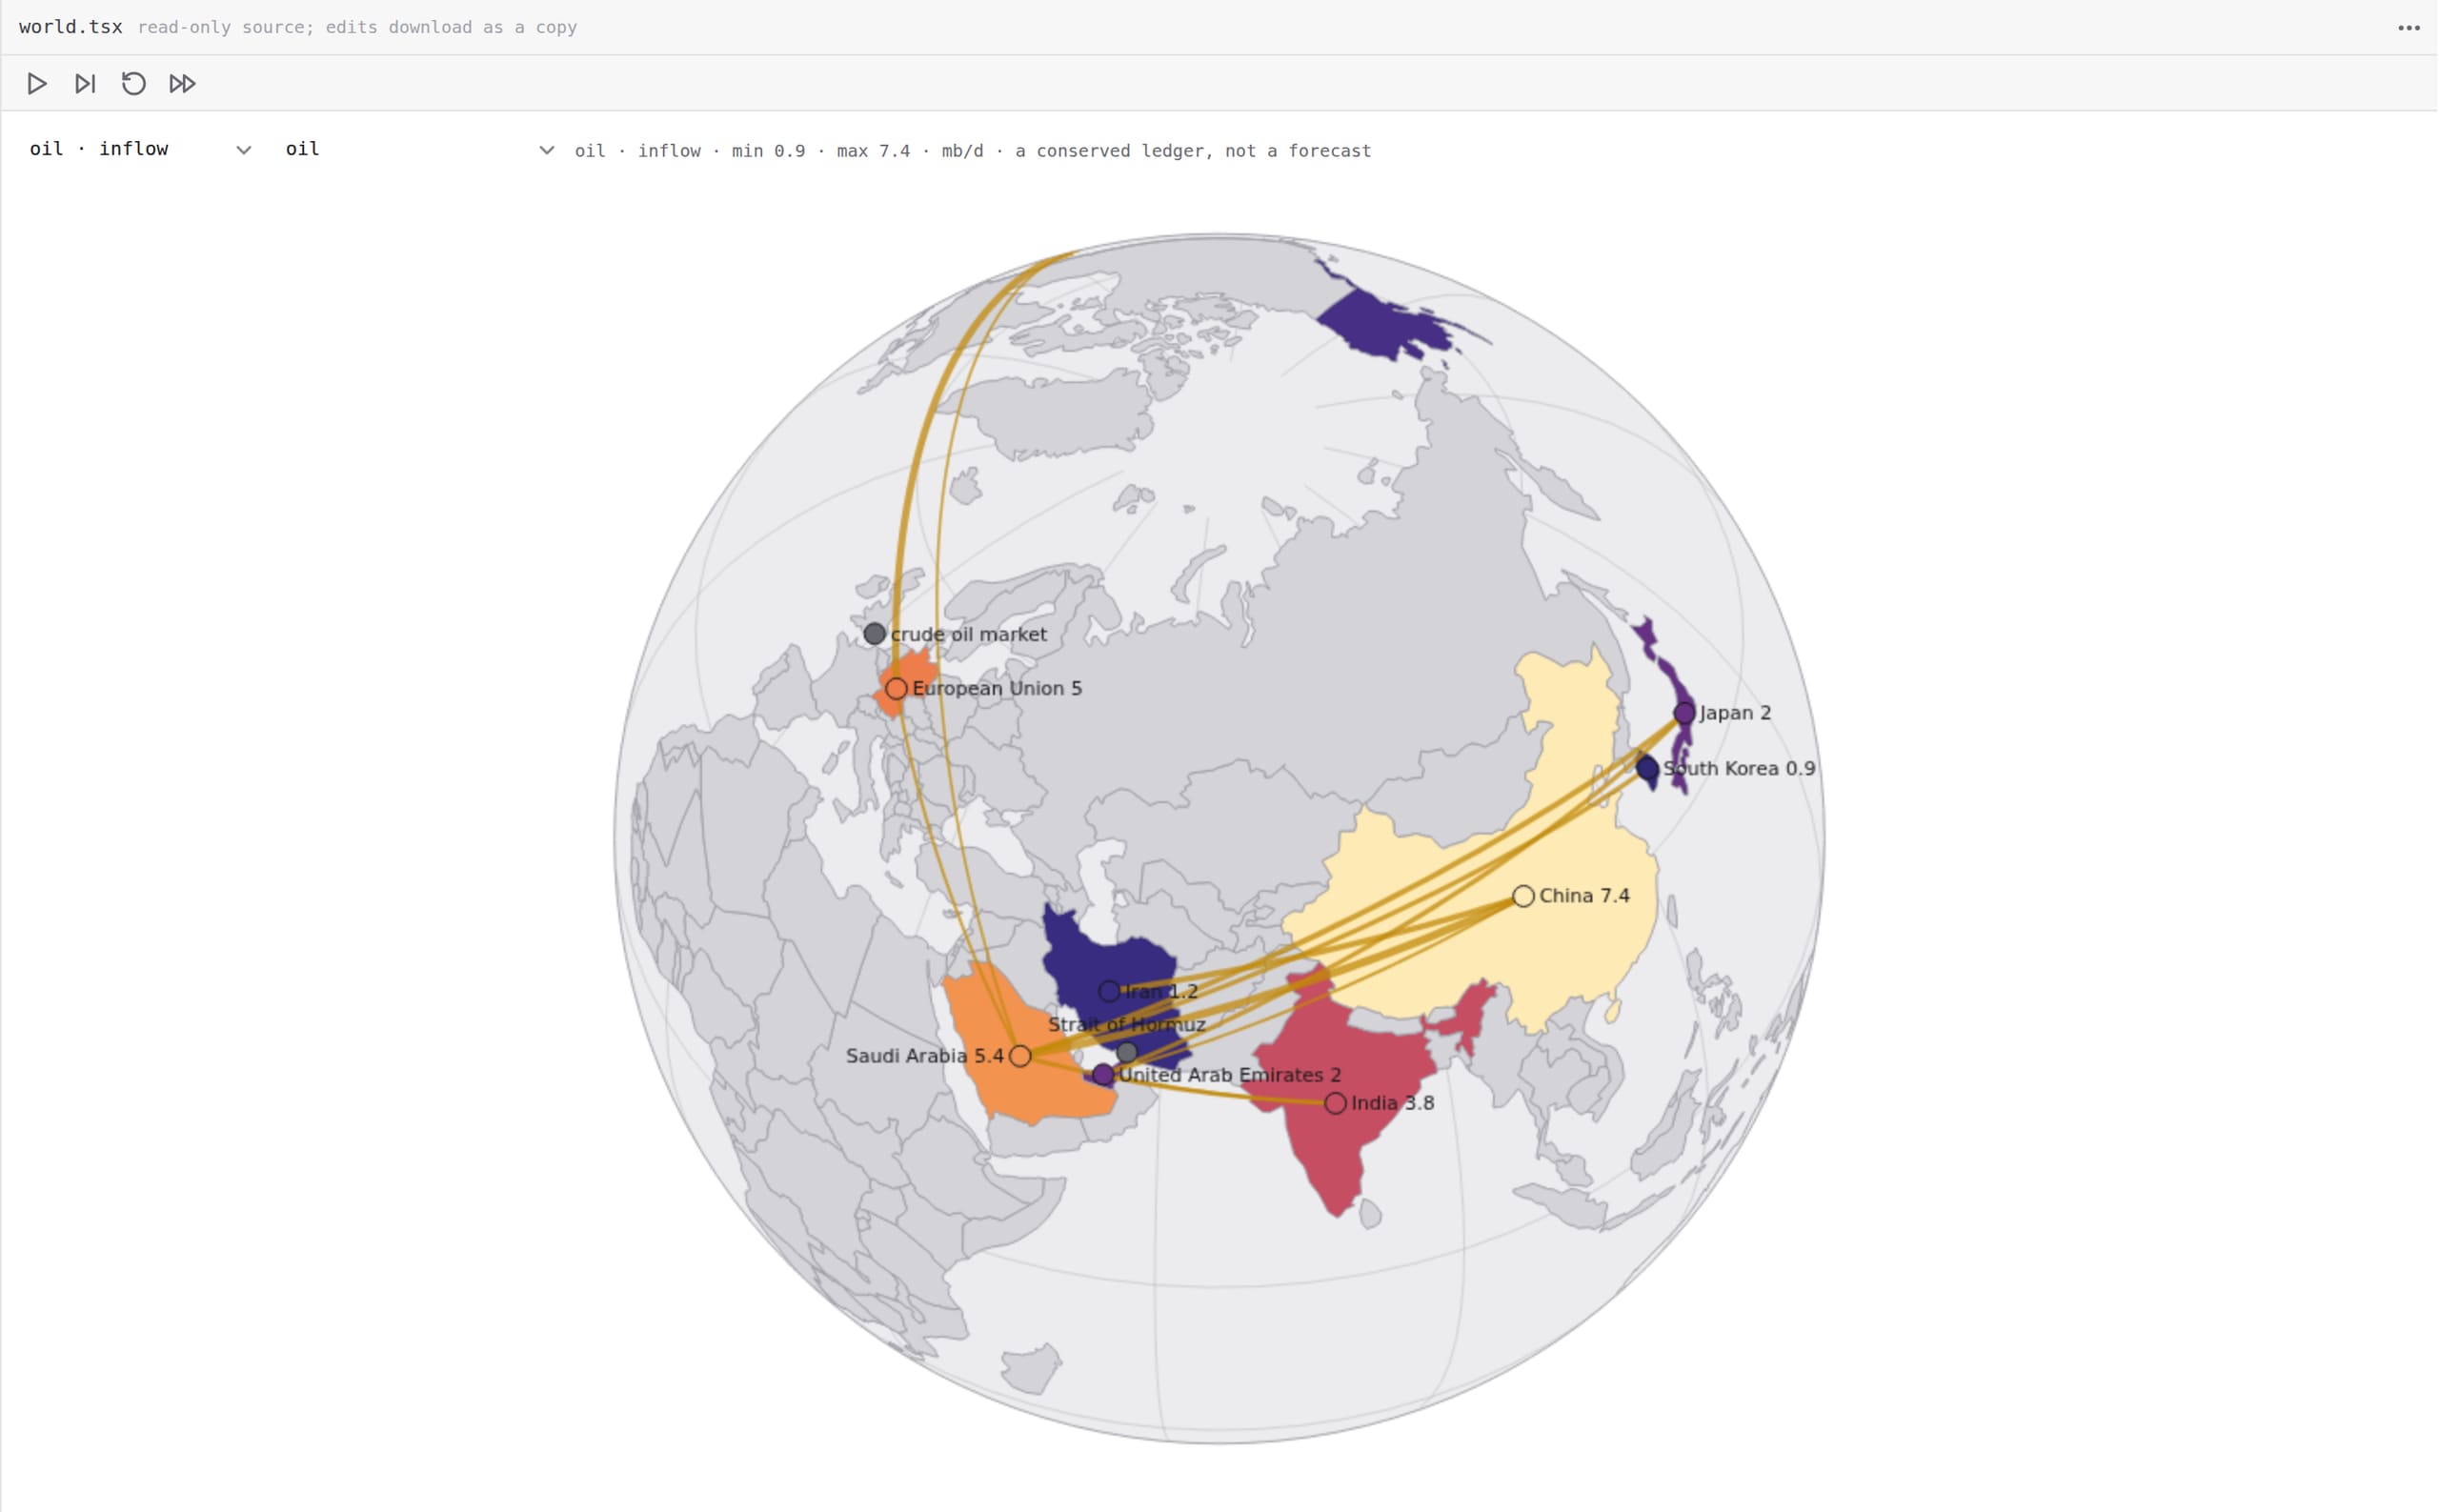
In the geo-hormuz simulation at escalation 1.8, the energy sector's required output falls from 1,060 to about 1,016 billion USD a day by day 60 and returns to 1,060 by day 120. Illustrative numbers, not data.
الأرقام
| Day | Energy output |
|---|---|
| 0 | 1060 |
| 10 | 1060 |
| 20 | 1050 |
| 30 | 1030 |
| 40 | 1020 |
| 50 | 1020 |
| 60 | 1020 |
| 70 | 1020 |
| 80 | 1020 |
| 90 | 1050 |
| 100 | 1060 |
| 110 | 1060 |
| 120 | 1060 |
cloud://global/examples/template-library/worlds/geo-hormuz/world.tsxOutput case-studies/hormuz/stats.jsonTool scripts/sites/case-studies.mjs hormuz: sim-engine.jsRan on This computer (dell-gb10-1)When Change a coefficient. Solve it again.
Every rate is a number in the world's file.